
FTSE 100: Key 7,200 Zone
The internet serves us, or indeed, overserves us with “expert” analysis of major stocks and markets from a technical perspective these days. However, sometimes, as in now, the pitch is queered by those with something to sell, or something to prove.
But in the case of the FTSE 100 the position on the daily chart can be simplified to a broken mildly rising trendline up to 7,200. What the bulls – who are heavily in denial at the moment – really need to dig themselves out of last week’s ambush, is an end of day close back above 7,200 as a minimum.

Indeed, only back above 7,550 really negates the cliff edge formation of the past week. The equivalent lines in the sand for the Dow and Dax are 24,450 and 12,520, with the view here being that if they are not conquered over the next 24 hours it is probably curtains for the great bull run. Keep in mind the word “if”, even though as things stand it looks as though the bulls have a done deal.
National Grid (NG.):
Perhaps the only thing worse than being in one of the most dull stock on the London market, is to be on the wrong side of such a company’s share price. For bulls looking to enjoy a defensive position at a rocky time, this group has not exactly delivered the goods.
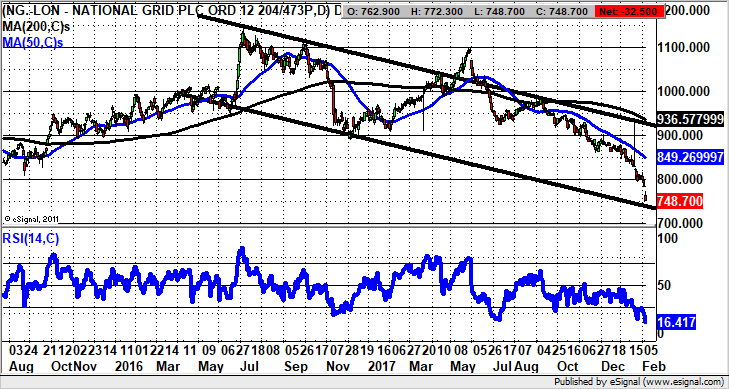
Indeed, the present position on the daily chart suggests that even though the stock is horrifically oversold at RSI 16/100, we could still suffer a probe to the floor of the 2016 price channel of 440p. Indeed, there could be a downside overshoot towards 720p – 730p intraday as a worst case scenario. Otherwise, above 740p one would at least hope for a dead cat bounce back to fill the initial February gap to the downside through 780p by the end of this month.
RELX Group (REL):
RELX (what a bad name for a company, or anything else for that matter) is another cliff edge chart with an ultra low RSI, and boasts not one but two unfilled gaps to the downside in the recent past. This should mean we are looking at the selling climax of the recent move, especially with the RSI at 12/100. However, it can be seen from the trajectory of the May price channel floor there is the risk of a further dip towards 1,400p over the next 2-4 weeks.
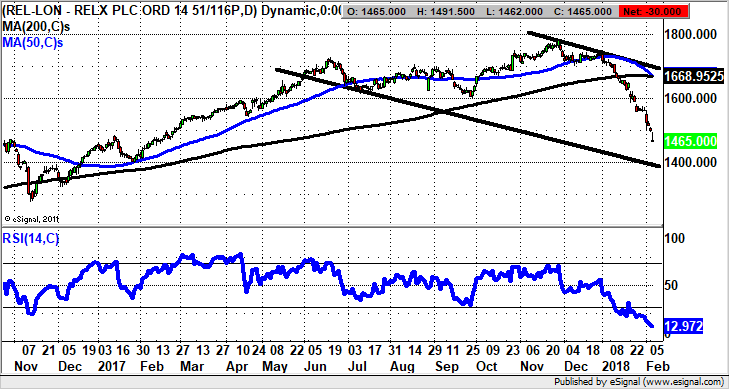
This is even if after that we are treated to a rebound back towards the former October 2016 peak at 514p soon after that.
Disclaimer
Zakmir.com is a purely journalistic website – Zak Mir is a member of the National Union of Journalists. There is no intention here of providing financial advice. It is recommended you seek an independent professional opinion before deciding whether or not to take any action with regard to anything written here.